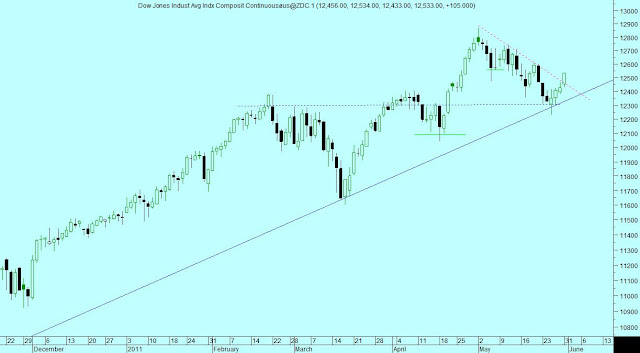
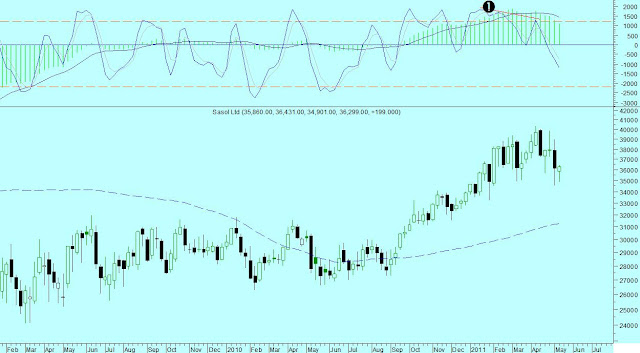
The Dow Jones found support around 12300 and broke the short-term resistance around 12450 to indicate the resumption of the overall uptrend.
Tuesday, May 31, 2011
Wednesday, May 11, 2011
DJ Global Index; Sasol Weekly & Daily; Brent Oil in Rand terms - 11 May 2011
(Click on image for larger view)
The Dow Jones Global Index pulled back to confirm horizontal and Fibonacci support and the oscillator is in buying territory. This is a buying opportunity in an ongoing bull market.
The sideways consolidation on Sasol looks like a "head-and-shoulders" reversal pattern, but is it?
Firstly, we must remember that a pattern is only completed when and if, the neckline breaks. Before that it is a sideways consolidation, with no strong directional meaning. The only indication that such a sideways consolidation might be completed to form a "head-and-shoulder" reversal pattern is if we see a negative divergence on a higher timescale. In this case we should see a negative divergence on the weekly MACD of RSI to confirm the likelihood of a break to the downside.
(Click on image for larger view)
Line -1- shows a divergence over the weekly Stochastic oscillator, but there is no divergence on the MACD. This in my book is a sideways consolidation in a longer-term uptrend. The price can drift sideways for a few weeks untill the stochastic reaches oversold levels.
(Click on image for larger view)
Sasol is a proxy for the the oil price in Rand. This is the picture that drives the price of Sasol. The MACD (green histogram) made a new high along with the price, telling us that the longer-term trend is positive. The weekly stochastic showed a negative divergence; warning of a shorter term correction which we are currently experiencing. The price can drift sideways or can even come down further but any pullback will be a buying opportunity in a longer-term bull market.
(Click on image for larger view)
If we look at the daily graph of Sasol, we see the price is confirming horizontal as well as strong Fibonacci support (green line). A stop for long positions will be just under 350. That will be a close under 345.
Tuesday, May 10, 2011
Brent Crude - 10 May 2011
Lower oil prices? Not likely!
Some commentators are convinced that the crash in the commodity market last week was the start of a longer-term decline in the price of oil and other commodities. What is the price movement (the "track") telling us?
(Click on image for larger view)
The "track" left by this animal tells us unmistakeably that it is heading north! The price came back to find rising support, Fibonacci support and the moving average between 105 and 110. While there are always many fundamental reasons why the price should decline or rise, the price movement does not lie. As long as support holds, the trend is positive.
The temporary correction in the US Dollar drove all commodities lower. The longer term trend for the Dollar is still weaker.
Monday, May 9, 2011
Copper weekly - 09 May 2011
How is Dr. Copper doing? Analysts view the price movement of copper as an indication of growth in the world. Copper is in demand at industrial and residential building projects and for production at factories. If the price of copper is in decline, it means that demand is lower because of lower production and building from the end users of copper. In the end it is an indication of the spending power of the global consumer.
Well what is it saying?
A textbook "rising wedge" pattern (red dotted lines) warned us of the crash of 2008. The market recovered to break out to a new high above line -1-. The price pulled back last week to test support at line -1-. A negative divergence on the short-term oscillator (Stochastic) warned us of the impending correction. However, there is no negative divergence on the longer term oscillator (MACD Histogram). This tells us that the price of copper is still in a longer-term uptrend. The stochastic indicator is in oversold territory on the weekly scale. As such it is giving a buying signal in a longer-term bull market.
Dr. Copper had a light sneeze but generally, he is in good health!
Tuesday, May 3, 2011
Dow Jones Futures - 03 May 2011
We trust that our regular readers enjoyed the Easter weekend, and are refreshed to face the trading opportunities as they present themselves.
While we stick to our longer-term positions in selected shares, we also manage shorter-term opportunities for those clients who wish to trade more actively in search of greater yield.
The International market had an excellent rally since middle March. It is time for a correction of this rally since the market is overbought on a daily and weekly scale. A pullback to 12400 will present another entry point in the rising trend. We use the Dow Jones Industrial Average as an indication of the health of the global market. By co-ordinating our entry points on selected JSE-listed stocks with pullbacks on the Dow, we increase our return on equity.
Such a pullback will give us a good "risk/reward" entry and an opportunity to add to current positions. Risk in this case is defined as the difference between the entry point and the stop loss level.
Subscribe to:
Comments (Atom)


