The Dow Jones Global Index pulled back to confirm horizontal and Fibonacci support and the oscillator is in buying territory. This is a buying opportunity in an ongoing bull market.
The sideways consolidation on Sasol looks like a "head-and-shoulders" reversal pattern, but is it?
Firstly, we must remember that a pattern is only completed when and if, the neckline breaks. Before that it is a sideways consolidation, with no strong directional meaning. The only indication that such a sideways consolidation might be completed to form a "head-and-shoulder" reversal pattern is if we see a negative divergence on a higher timescale. In this case we should see a negative divergence on the weekly MACD of RSI to confirm the likelihood of a break to the downside.
(Click on image for larger view)
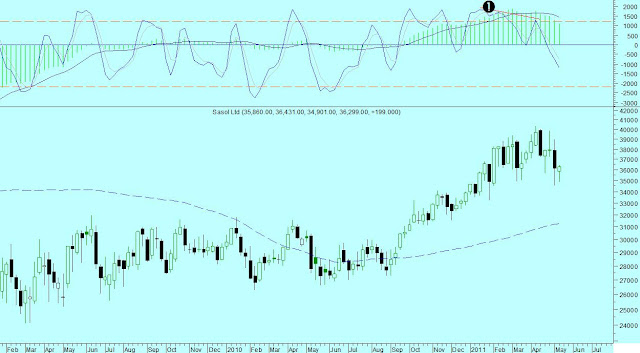
Line -1- shows a divergence over the weekly Stochastic oscillator, but there is no divergence on the MACD. This in my book is a sideways consolidation in a longer-term uptrend. The price can drift sideways for a few weeks untill the stochastic reaches oversold levels.
(Click on image for larger view)
Sasol is a proxy for the the oil price in Rand. This is the picture that drives the price of Sasol. The MACD (green histogram) made a new high along with the price, telling us that the longer-term trend is positive. The weekly stochastic showed a negative divergence; warning of a shorter term correction which we are currently experiencing. The price can drift sideways or can even come down further but any pullback will be a buying opportunity in a longer-term bull market.
(Click on image for larger view)
If we look at the daily graph of Sasol, we see the price is confirming horizontal as well as strong Fibonacci support (green line). A stop for long positions will be just under 350. That will be a close under 345.


